Elderberry Expert Rating and Opinion
The Elderberry Index for Pennwood Village is 4.04 out of 5, compared with a national average of 3.81. Three findings stand out as positive, and three are worth a closer look.
Things we noticed
Positive standouts
Care and registered-nurse targets met in four reported quarters
The latest quarter records 235 minutes against a 220-minute daily care target; RN time is 45 against 45.
Staffing rating exceeds the national average
5 out of 5, compared with 3.18 across other rated homes in the August 2026 extract.
Staff communication is a relative strength
92% answered “Always” or “Most of the time”, compared with 80.2% across other homes.
Worth a closer look
Fewer residents consistently feel safe
72% answered “Always” or “Most of the time”, compared with 96.3% across other homes.
Food enjoyment fell in the latest survey
72% positive in 2026, compared with 85% in 2025: 13 percentage points lower.
Getting needed care is below the survey average
72% answered “Always” or “Most of the time”, compared with 94.4% across other homes.
Sources and Explanation
This is a programmatic interpretation of published data, not an in-person inspection or a separate expert-assigned score. The figures are the Elderberry Index and its four government component ratings; a measure the home has no published rating for is left out. Our rating methodology.
Ratings: August 2026. Survey comparisons: 2026 interview responses from that extract. Other Australian homes in the same ratings extract; survey comparisons also require the same interview year. Each eligible home has equal weight; missing/invalid values excluded. These are descriptive comparisons, not resident-weighted or adjusted for differences in care needs.
How findings are selected
Survey gaps of at least 3 percentage points, rating gaps of at least 0.3 stars, and changes of at least 10 percentage points can qualify. These are editorial selection thresholds, not tests of statistical significance. Benchmarks need at least 30 homes. Each side shows up to three eligible findings; missing values never become negative findings. Specific combined food evidence and sustained care-target results are prioritised, then larger differences. Respect and caring are grouped when both qualify.
Food spending uses the My Aged Care sector median for Jan–Mar 2026; resident enjoyment comes from the 2026 survey. The combined finding reports two separate observations from different reporting periods; it does not establish that spending caused the survey result. Year-to-year survey samples may differ and respondent counts are unavailable. Care consistency uses the latest four submitted, quality-checked care-minute records and direct RN minutes without EN top-up.
A lower compliance rating is a comparison with other homes, not a claim of an active sanction. Higher expenditure alone is not treated as better care. Unadjusted clinical incident measures are not used to rank quality here.
My Aged Care home profile · Government Star Ratings extract
Benchmark populations
| Measure | Mean | Other homes |
|---|---|---|
| Elderberry Index | 3.81 | 2365 |
| Residents’ experience | 3.62 | 2434 |
| Compliance | 4.83 | 2395 |
| Staffing | 3.18 | 2454 |
| Quality measures | 3.07 | 2456 |
| Respectful treatment | 95.37% | 1080 |
| Feeling safe | 96.27% | 1080 |
| How well the home is run | 88.08% | 1080 |
| Getting needed care | 94.44% | 1080 |
| Confidence in staff skills | 89.10% | 1080 |
| Encouragement to stay independent | 87.17% | 1079 |
| Staff explaining things | 80.25% | 1078 |
| Enjoying the food | 67.33% | 1080 |
| Following up concerns | 84.22% | 1079 |
| Kind and caring staff | 95.43% | 1080 |
| Having a say in daily life | 92.72% | 1080 |
What do residents say about Pennwood Village?
When residents surveyed at Pennwood Village for the 2026 Residents’ Experience Survey were asked whether they feel safe, 72% answered “always” or “most of the time”, 24.3 percentage points below the average of 96.3% across other homes. When residents were asked whether they get the care they need (72% against 94.4%) and whether staff know what they are doing (71% against 89.1%), answers were also below the average for other homes.
The largest gap above other homes was when residents were asked whether staff explain things to them: 92% answered “always” or “most of the time”, against an average of 80.2%.
What should you ask about on a visit?
A visit is a chance to ask about what the home does when a resident says they feel unsafe. Of residents asked whether they feel safe, 43% answered “always”, 29% “most of the time”, 21% “some of the time” and 7% “never”.
Do residents have a say in daily life?
For choice and independence, the share of “always” or “most of the time” answers at Pennwood Village was 78% when asked whether they have a say in their daily activities and 71% when asked whether they are encouraged to do as much as possible for themselves.
How much care and nursing does Pennwood Village provide?
In January to March 2026, Pennwood Village reported 235 minutes of care per resident per day, 15 minutes above its target of 220 minutes. Registered nurses provided 45 of those minutes, matching the registered-nurse target of 45.
In each of the last four quarters, Pennwood Village met both its total and registered-nurse targets. Minutes of care per resident per day ranged from 226 to 237 across those four quarters.
Who provides that care?
Per resident per day, personal care workers provided 146 minutes, followed by registered nurses (45 minutes) and enrolled nurses (43 minutes). Pennwood Village also reported spending on physiotherapists, speech pathologists, dietitians, and lifestyle and recreation workers in the same quarter.
How does Pennwood Village spend on resident care?
Spending on care and nursing at Pennwood Village in the 2024–25 financial year was $323.51 per resident per day, 22% above the sector median of $264.85. Spending across all categories was $484.92 per resident per day. These figures are the home’s costs, not the fees a resident pays.
Where does the rest of the spending go?
Other categories included accommodation and maintenance ($42), cleaning and laundry ($40.50) and administration ($26.54) per resident per day. Within care and nursing, the largest amounts per resident per day went to personal care workers and assistants in nursing ($145.37) and registered nurses ($59.25).
What is the food like at Pennwood Village?
In the 2026 Residents’ Experience Survey, 72% of residents surveyed at Pennwood Village said they like the food “always” or “most of the time”, 4.7 percentage points above the average of 67.3% across other homes. The share fell from 85% in 2025. Another 21% answered “some of the time” and 7% “never”.
Food spending at Pennwood Village in January to March 2026 was $18 per resident per day, 13% above the sector median of $16. Spending on dietitians in the same quarter was $0.50 per resident per day, 79% above the sector median of $0.28.
How are meals prepared?
Pennwood Village reports that breakfast, lunch and dinner are all cooked fresh. All meals are prepared on site.
Do residents enjoy the food?
Residents who answered “Always” or “Most of the time”.
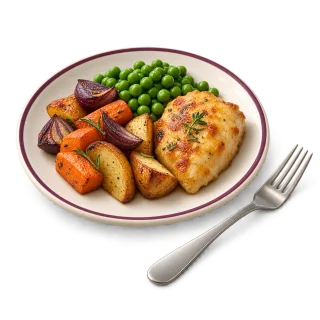
72% of surveyed residents
Spending & preparation
Daily spending on food and dietitian services, and how meals are prepared.